Announcements
Lab 7 optional, turn in by end of day Friday 6/9
HW4 due Wednesday 6/7 with late submissions by Friday 6/9
Course project due Friday 6/16; groups preferred, max of 3
Extra OH Tuesday 1-3pm (scheduled final time)?
Last time
We fit the logistic regression model:
\[
\log\left(\frac{Pr(\text{diabetic}_i)}{1 - Pr(\text{diabetic}_i)}\right) = \beta_0 + \beta_1\text{age}_i + \beta_2\text{male}_i+\beta_3\text{BMI}_i
\]
And discussed:
model specification
parameter estimation
parameter interpretation
Last time
The logistic regression model can be employed as a classifier by articulating a rule:
\[
\text{classify as diabetic}
\quad\Longleftrightarrow\quad
\widehat{Pr}(\text{diabetic}) > c
\]
where \(\widehat{Pr}(\text{diabetic})\) is computed from the fitted logistic regression model.
Any classifier has some:
sensitivity (true positive rate)
specificity (true negative rate)
These rates vary depending on \(c\) .
ROC Curves
A plot of sensitivity against specificity across all unique classification thresholds is known as a receiver operating characteristic (ROC) curve.
Code
# compute from sklearn import metrics= metrics.roc_curve(y, fitted_probs)= pd.DataFrame({'fpr' : fpr,'tpr' : tpr,'thresh' : thresh= [(roc.tpr - roc.fpr).argmax(), ((1 - roc.tpr)** 2 + roc.fpr** 2 ).argmin()]= roc.loc[roc_opt_ix]= alt.Chart(roc).mark_line().encode(= alt.X('fpr' , title = '1 - specificity' ),= alt.Y('tpr' , title = 'sensitivity' )= alt.Chart(roc_opt).mark_circle(= 'red' ,= 100 = 'fpr' ,= 'tpr' + roc_pts).configure_axis(= 14 ,= 16
closer to the upper left corner \(\longrightarrow\) less trade-off \(\longrightarrow\) better classifier
area under the curve often used as an accuracy metric
two common choices for \(c\) highlighted:
the point closest to the upper left corner
the point that maximizes sensitivity + specificity (sometimes called Youden’s J statistic )
Probit regression model
Logistic regression is not the only regression model for binary data. One common alternative is probit regression , where:
\[
P(Y = 1) = \Phi\left(x'\beta\right)
\]
\(\Phi\) is the standard normal CDFsimilar assumptions to logistic regression – independence and monotonicity
Probit v. logit
The logistic function has heavier tails.
Code
from scipy.stats import norm# grid of values = pd.DataFrame({'x' : np.linspace(- 5 , 5 , 200 )# compute probit and logit 'logit' ] = 1 / (1 + np.exp(- vals.x))'probit' ] = norm.cdf(vals.x)= vals.melt(id_vars = 'x' , var_name = 'model' , value_name = 'pr' )# plot = alt.X('x' , title = 'x*beta' ),= alt.Y('pr' , title = 'Pr(Y = 1)' ),= 'model' ,= 'model' = 14 ,= 16 = 14 ,= 16
Probit fit to diabetes data
Here are the estimates from the probit model:
Code
# fit model = sm.Probit(endog = y, exog = x)= model_probit.fit()# parameter estimates = pd.DataFrame({'estimate' : fit_probit.params,'standard error' : np.sqrt(fit_probit.cov_params().values.diagonal())},= x.columns
Optimization terminated successfully.
         Current function value: 0.214265
         Iterations 8
const
-4.215812
0.172291
male
0.116145
0.061036
Age
0.025876
0.001733
BMI
0.051143
0.004201
Trickier to interpret coefficients directly, since \(\Phi^{-1}(p)\) is not a natural quantity
Challenges of interpretation
The effect of incremental changes in explanatory variables on predicted probabilities depends on your starting point.
# means of explanatory variables = x.mean()# increment bmi twice = x1 + np.array([0 , 0 , 0 , 1 ])= x2 + np.array([0 , 0 , 0 , 1 ])= pd.concat([x1, x2, x3], axis = 1 ).T'male' ] = np.array([0 , 0 , 0 ])# compute predictions and differences in probability = fit_probit.predict(x_pred)
0         NaN
1    0.003587
2    0.003941
dtype: float64
a one-unit increase in BMI from 26.45 (sample mean) for a 37.6 year old woman is associated with an estimated change in probability of diabetes of 0.0036
a one-unit increase in BMI from 27.45 (sample mean plus one) for a 37.6 year old woman is associated with an estimated change in probability of diabetes of 0.0039
Centering for interpretability
If explanatory variables are centered, then the change in estimated probability associated with a 1-unit change from the mean (and reference level(s)) is:
\[
\Phi\left(\hat{\beta}_0 + \hat{\beta}_j\right) - \Phi\left(\hat{\beta}_0\right)
\]
Refitting the model after centering age and BMI and computing the above yields:
Code
# center explanatory variables = x_vars - x.mean()= pd.concat([x.loc[:, ['const' , 'male' ]], x_vars_ctr.loc[:, ['Age' , 'BMI' ]]], axis = 1 )# fit model = sm.Probit(endog = y, exog = x_ctr)= model_probit_ctr.fit()# baseline = norm.cdf(fit_probit_ctr.params[0 ])# changes in estimated probabilities associated with one-unit change from mean, keeping other variables at mean/reference = norm.cdf(fit_probit_ctr.params[1 :4 ] + fit_probit_ctr.params[0 ]) - probit_baseline# print 'change in probability' : prob_diffs}, index = np.array(['male' , 'age' , 'BMI' ]))
Optimization terminated successfully.
         Current function value: 0.214265
         Iterations 8
male
0.008659
age
0.001772
BMI
0.003587
Centering for interpretation
Now the coefficent interpretations are:
the estimated probability that a woman of average age and BMI has diabetes is 0.029
among people of average age and BMI, men are more likely than women to be diabetic with an estimated difference in probability of 0.009
\(0.008659 = \Phi(\hat{\beta}_0 + \hat{\beta}_1) - \Phi(\hat{\beta}_0)\)
a one-year increase from the average age is associated with a change in the estimated probability that a woman of average BMI is diabetic of 0.002
\(0.001772 = \Phi(\hat{\beta}_0 + \hat{\beta}_2) - \Phi(\hat{\beta}_0)\)
a one-unit increase in BMI from the average is associated with a change in the estimated probability that a woman of average age is diabetic of 0.004
\(0.003587 = \Phi(\hat{\beta}_0 + \hat{\beta}_3) - \Phi(\hat{\beta}_0)\)
Un/Supervised problems
Regression and classification are known as ‘supervised’ problems:
the response variable/outcome is observed
the modeling of data is guided by observation
By contrast, in ‘unsupervised’ problems:
the response variable/outcome is not observed
no ground truth to guide/supervise the modeling process
Clustering
Clustering is the unsupervised version of classification:
Can we classify observations into two or more groups based on \(p\) variables without knowing the true grouping structure?
can think of this as modeling an unobserved response
however, not necessary that there exist subpopulations in the data – often a useful exploratory technique for exploring multimodal distributions
Voting records, 116th House
Roll call votes of the 116th House of Representatives on bills and resolutions:
Code
= pd.read_csv('data/members.csv' ).set_index('name_id' )= pd.read_csv('data/votes-clean.csv' ).set_index('name_id' )= pd.read_csv('data/votes-info.csv' ).set_index('rollcall_id' )3 )
name_id
A000374
-1
-1
-1
-1
-1
0
-1
1
0
1
...
1
0
1
0
1
1
-1
1
-1
-1
A000370
1
1
1
1
1
0
1
1
1
1
...
1
1
1
1
1
1
1
1
1
1
A000055
-1
-1
-1
-1
-1
-1
-1
1
1
1
...
1
1
1
1
1
1
-1
1
1
-1
3 rows × 144 columns
each column is a roll call (\(p = 144\) total)
each row is a representative (\(n = 430\) total)
1 is a “yes” vote; 0 is an abstention; -1 is a “no” vote
Clustering voting data
Question: Can we identify groups of representatives that voted similarly?
Can cluster the representatives according to roll call votes
But how many clusters to expect?
EDA with PCA
Projecting the data onto the first few principal components provides a way to visualize the data:
Code
= sm.PCA(votes)= 0.5 ).encode(= alt.X('comp_000' , title = 'PC1' ),= alt.Y('comp_001' , title = 'PC2' )= 14 ,= 16 = 14 ,= 16
can see at least two clusters
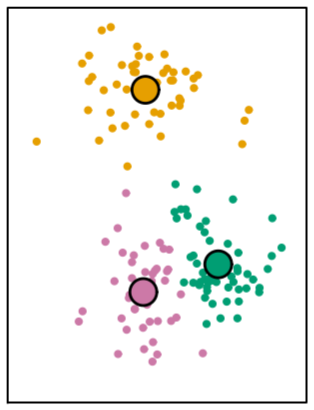
Clustering with \(K\) -means
The most widely used clustering method is known as \(K\) -means.
cluster labels are based on shortest Euclidean distance to one of \(K\) centers
centers are found by minimizing the variance within each cluster
Clustering voting data
The method is very easy to implement:
from sklearn.cluster import KMeans60623 )= KMeans(n_clusters = 2 )= clust.predict(votes)
Cluster labels will be returned in the same order as the rows input to .predict()
Initialization is random, so solutions may differ from run to run (usually just permutes labels).
Clustering voting data
We could again visualize the clusters using PCA:
Code
= pca.scores.iloc[:, 0 :2 ].copy()'cluster' ] = clust_labels= 0.5 ).encode(= alt.X('comp_000' , title = 'PC1' ),= alt.Y('comp_001' , title = 'PC2' ),= 'cluster:N' = 14 ,= 16 = 14 ,= 16
Cluster composition by party
We could also cross-tabulate the cluster labels with party affiliations:
Code
= pd.DataFrame({'cluster' : clust_labels}, index = votes.index)= True , right_index = True ).groupby(['current_party' , 'cluster' ]).size().reset_index().pivot(columns = 'current_party' , index = 'cluster' )
current_party
Democratic
Independent
Republican
0
232.0
NaN
3.0
1
NaN
1.0
194.0
Cluster composition by party
Who are those three representatives that vote with the democrats?
Code
= pd.merge(members, label_df, left_index = True , right_index = True )== 0 ) & (members_labeled.current_party == 'Republican' )]
name_id
F000466
brian-fitzpatrick
Pennsylvania
https://www.congress.gov/member/brian-fitzpatr...
House
Republican
['Foreign Affairs', 'Transportation and Infras...
0
K000386
john-katko
New York
https://www.congress.gov/member/john-katko/K00...
House
Republican
['Homeland Security', 'Transportation and Infr...
0
S000522
christopher-smith
New Jersey
https://www.congress.gov/member/christopher-sm...
House
Republican
['Foreign Affairs']
0
Further possible questions
We could use the same technique to explore a variety of additional questions:
identify voting blocs by issue or policy area (use a subset of columns)
find within-party voting blocs (increase \(K\) )
identify representatives that don’t tend to vote together with others (assign a score based on how ‘quickly’ a representative is isolated)