population mean:  54.73771716352954
sample mean: 56.567779534464016Sampling and missingness
Invalid Date
Announcements
- First mini project released: air quality in U.S. cities
- Lab 1 (pandas) due Monday 4/17 11:59pm PST
- HW 1 due in one week on Monday 4/24
This week
Objective: Enable you to critically assess data quality based on how it was collected.
- Sampling and statistical bias
- Sampling terminology
- Common sampling scenarios
- Sampling mechanisms
- Statistical bias
- The missing data problem
- Types of missingness: MCAR, MAR, and MNAR
- Pitfalls and simple fixes
- Case study: voter fraud
- Steven Miller’s analysis of Voter Integrity Fund surveys
- Sources of bias
- Ethical considerations
Sampling terminology
Here we’ll introduce standard statistical terminology to describe data collection.
All data are collected somehow. A sampling design is a way of selecting observational units for measurement. It can be construed as a particular relationship between:
- a population (all entities of interest);
- a sampling frame (all entities that are possible to measure); and
- a sample (a specific collection of entities).

Population
Last week, we introduced the terminology observational unit to mean the entity measured for a study – datasets consist of observations made on observational units.
In less technical terms, all data are data on some kind of thing, such as countries, species, locations, and the like.
A statistical population is the collection of all units of interest. For example:
- all countries (GDP data)
- all mammal species (Allison 1976)
- all babies born in the US (babynames data)
- all locations in a region (SB weather data)
- all adult U.S. residents (BRFSS data)
Sampling frame
There are usually some units in a population that can’t be measured due to practical constraints – for instance, many adult U.S. residents don’t have phones or addresses.
For this reason, it is useful to introduce the concept of a sampling frame, which refers to the collection of all units in a population that can be observed for a study. For example:
- all countries reporting economic output between 1961 and 2019
- all babies with birth certificates from U.S. hospitals born between 1990 and 2018
- all adult U.S. residents with phone numbers in 2019
Sample
Finally, it’s rarely feasible to measure every observable unit due to limited data collection resources – for instance, states don’t have the time or money to call every phone number every year.
A sample is a subcollection of units in the sampling frame actually selected for study. For instance:
- 234 countries;
- 62 mammal species;
- 13,684,689 babies born in CA;
- 1 weather station location at SB airport;
- 418,268 adult U.S. residents.
Sampling scenarios
We can now imagine a few common sampling scenarios by varying the relationship between population, frame, and sample.
Denote an observational unit by Ui, and let:
U={Ui}i∈I(universe)P={U1,…,UN}⊆U(population)F={Uj:j∈J⊂I}⊆P(frame)S⊆F(sample)
Census
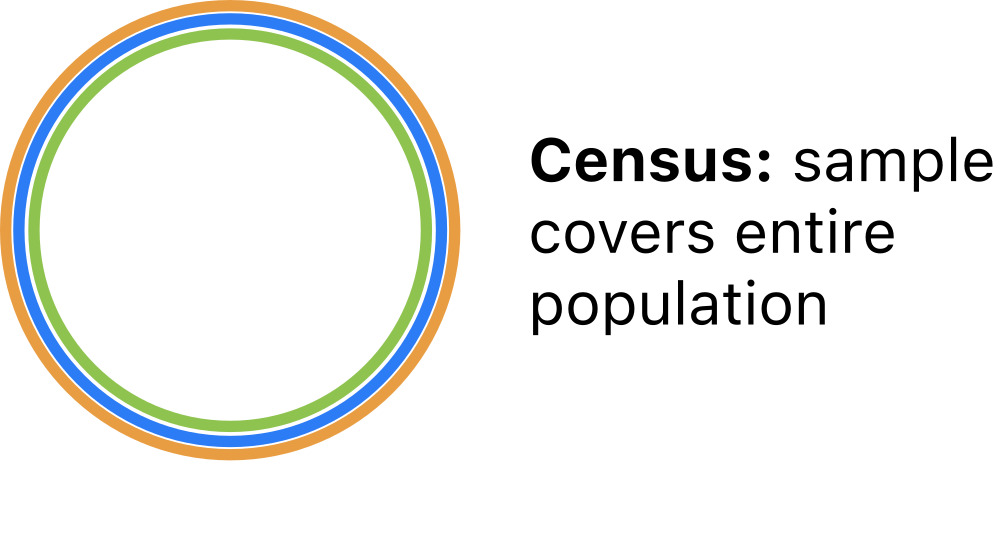
The simplest scenario is a population census, where the entire population is observed.
For a census: S=F=P
All properties of the population are definitevely known in a census. So there is no need to model census data.

Simple random sample
The statistical gold standard for inference, modeling, and prediction is the simple random sample in which units are selected at random from the population.
For a simple random sample: S⊂F=P
Sample properties are reflective of population properties in simple random samples. Population inference is straightforward.

‘Typical’ sample
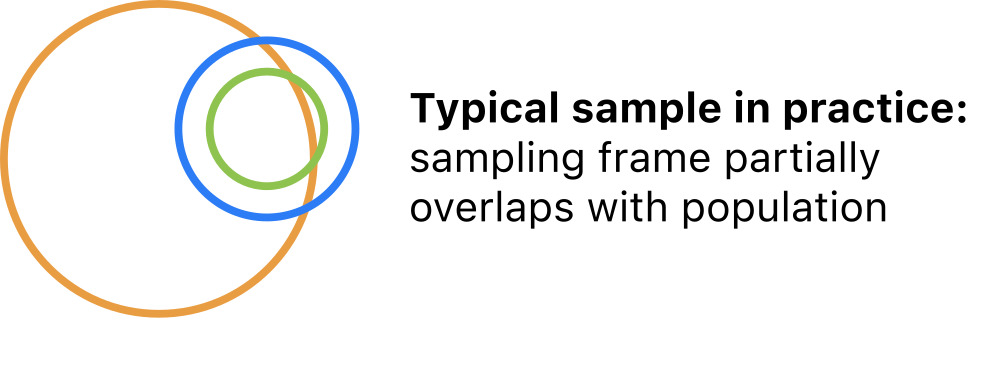
More common in practice is a random sample from a sampling frame that overlaps but does not cover the population.
For a ‘typical’ sample: S⊂FandF∩P≠∅
Sample properties are reflective of the frame but not necessarily the study population. Population inference gets more complicated and may not be possible.

‘Administrative’ data
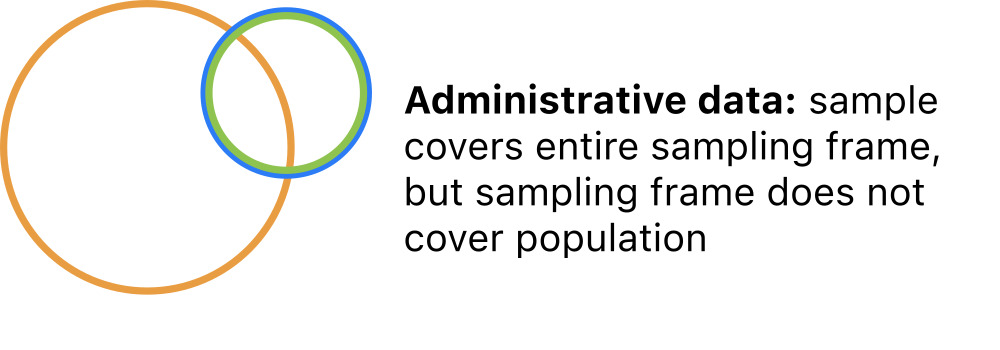
Also common is administrative data in which all units are selected from a convenient frame that partly covers the population.
For administrative data: S=FandF∩P≠∅
Administrative data are not really proper samples; they cannot be replicated and they do not represent any broader group. No inference is possible.

Scope of inference
The relationships among the population, frame, and sample determine the scope of inference: the extent to which conclusions based on the sample are generalizable.
A good sampling design can ensure that the statistical properties of the sample are expected to match those of the population. If so, it is sound to generalize:
- the sample is said to be representative of the population
- the scope of inference is broad
A poor sampling design will produce samples that distort the statistical properties of the population. If so, it is not sound to generalize:
- sample statistics are subjet to bias
- the scope of inference is narrow
Characterizing sampling designs
The sampling scenarios above can be differentiated along two key attributes:
- The overlap between the sampling frame and the population.
- frame = population
- frame ⊂ population
- frame ∩ population ≠∅
- The mechanism of obtaining a sample from the sampling frame.
- random sampling
- convenience sampling
If you can articulate these two points, you have fully characterized the sampling design.
Sampling mechanisms
In order to describe sampling mechanisms precisely, we need a little terminology.
Each unit has some inclusion probability – the probability of being included in the sample.
Let’s suppose that the frame F comprises N units, and denote the inclusion probabilities by:
pi=P(unit i is included in the sample)i=1,…,N
The inclusion probability of each unit depends on the physical procedure of collecting data.
Sampling mechanisms
Sampling mechanisms are methods of drawing samples and are categorized into four types based on inclusion probabilities.
- in a census every unit is included
- pi=1 for every unit i=1,…,N
- in a random sample every unit is equally likely to be included
- pi=pj for every pair of units i,j
- in a probability sample units have different inclusion probabilities
- pi≠pj for at least one i≠j
- in a nonrandom sample there is no random mechanism
- pi=1 for i∈S
Revisiting example datasets: GDP
Annual observations of GDP growth for 234 countries from 1961 - 2018.
- Population: all countries in existence between 1961-2019.
- Frame: all countries reporting economic output for at least one year between 1961 and 2019.
- Sample: equal to frame.
So:
- Overlap: frame partly overlaps population.
- Mechanism: sample is every country in the sampling frame.
This is administrative data with no scope of inference.
Revisiting example datasets: BRFSS data
Phone surveys of 418K U.S. residents in 2019.
- Population: all U.S. residents.
- Frame: all adult U.S. residents with phone numbers.
- Sample: 418K adult U.S. residents with phone numbers.
So:
- Overlap: frame is a subset of the population.
- Mechanism: probability sample.
- Randomly selected phone numbers were dialed in each state, so individuals in less populous states or with multiple numbers are more likely to be included
This is a typical sample with narrow inference to adult residents with phone numbers.
Statistical bias
Statistical bias is the average difference between a sample property and a population property across all possible samples under a particular sampling design.
In less technical terms: the expected error of estimates.
Two possible sources of statistical bias:
- An estimator systematically over- or under-estimates its target population property
- e.g., 1n∑i(xi−ˉx)2 is biased for (underestimates) the population variance
- Sampling design systematically over- or under-represents certain observational units
- e.g., studies conducted on college campuses are biased towards (overrepresent) young adults
These are distinct from other kinds of bias that we are not discussing:
- Measurement bias: attributes or outcomes are measured unevenly across populations
- Experimenter bias: study design and/or outcomes favor an investigator’s preconceptions
Sampling bias
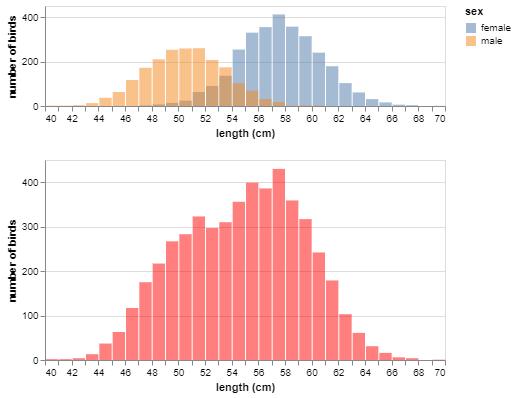
In Lab 2 you’ll explore sampling bias arising from sampling mechanisms. Here’s a preview:

Consider:
- Are males or females generally longer?
- How will the sample mean shift if disproportionately more males are sampled?
- If disproportionately more females are sampled?
Bias corrections
If inclusion probabilities are known or estimable it is possible to apply bias corrections to estimates using inverse probability weighting.
If
- pi is the probability that individual i is included in the sample S
- Yi are observations of a variable of interest
Then a bias-corrected estimate of the population mean is given by the weighted average:
∑i∈S(p−1i∑ip−1i)Yi
Bias correction example
Suppose we obtain a biased sample in which female hawks were 6 times as likely to be selected as males. This yields an overestimate:
But since we know the exact inclusion probabilities up to a proportionality constant, we can apply inverse probability weighting to adjust for bias:
# specify weights s.t. 6:1 female:male
weight_df = pd.DataFrame(
    data = {'sex': np.array(['male', 'female']),
            'weight': np.array([1, 6])})

# append weights to sample
samp_w = pd.merge(samp, weight_df, how = 'left', on = 'sex')

# calculate inverse probability weightings
samp_w['correction_factor'] = (1/samp_w.weight)/np.sum(1/samp_w.weight)

# multiply observed values by weightings
samp_w['weighted_length'] = samp_w.length*samp_w.correction_factor

# take weighted average
samp_w.weighted_length.sum()54.40928091743469Bias correction example
However, even if we didn’t know the exact inclusion probabilities, we could estimate them from the sample:
And use the same approach:
# estimate factor by which F more likely than M
ratio = samp.sex.value_counts().loc['female']/samp.sex.value_counts().loc['male']

# input as weights
weight_df = pd.DataFrame(data = {'sex': np.array(['male', 'female']), 'weight': np.array([1, ratio])})

# append weights to sample
samp_w = pd.merge(samp, weight_df, how = 'left', on = 'sex')

# calculate inverse probability weightings
samp_w['correction_factor'] = (1/samp_w.weight)/np.sum(1/samp_w.weight)

# multiply observed values by weightings
samp_w['weighted_length'] = samp_w.length*samp_w.correction_factor

# take weighted average
samp_w.weighted_length.sum()54.082235672430265Remarks on IPW and bias correction
Inverse probability weighting can be applied to correct a wide range of estimators besides averages.
It is also applicable to adjust for bias due to missing data.
In principle, the technique is simple, but in practice, there are some common hurdles:
- usually inclusion probabilities are not known
- estimating inclusion probabilities can be difficult and messy
Missingness
Missing data arise when one or more variable measurements fail for a subset of observations.
This can happen for a variety of reasons, but is very common in pratice due to, for instance:
- equipment failure;
- sample contamination or loss;
- respondents leaving questions blank;
- attrition (dropping out) of study participants.
Many researchers and data scientists ignore missingness by simply deleting affected observations, but this is bad practice! Missingness needs to be treated carefully.
Missing representations
It is standard practice to record observations with missingness but enter a special symbol (.., -, NA, etcetera) for missing values.
In python, missing values are mapped to a special float:
Missing representations
Here is some made-up data with two missing values:
| value | |
|---|---|
| obs | |
| 0 | -0.9286936933427271 |
| 1 | -0.3088381742999848 |
| 2 | - |
| 3 | -1.4345064041945543 |
| 4 | 0.03958917896644836 |
| 5 | - |
| 6 | -0.5316890502224456 |
| 7 | 1.4734842645335422 |
Missing representations
If we read in the file with an na_values argument, pandas will parse the specified characters as NaN:
Calculations with NaNs
NaNs halt calculations on numpy arrays.
However, the default behavior in pandas is to ignore the NaN’s, which allows the computation to proceed:
Omitting missing values alters results
But those missing values could have been anything. For example:
So missing values can dramatically alter results if they are simply omitted from calculations!
The missing data problem
In a nutshell, the missing data problem is: how should missing values be handled in a data analysis?
Getting the software to run is one thing, but this alone does not address the challenges posed by the missing data. Unless the analyst, or the software vendor, provides some way to work around the missing values, the analysis cannot continue because calculations on missing values are not possible. There are many approaches to circumvent this problem. Each of these affects the end result in a different way. (Stef van Buuren, 2018)
There’s no universal approach to the missing data problem. The choice of method depends on:
- the analysis objective;
- the missing data mechanism.
Missing data in PSTAT100
We won’t go too far into this topic in PSTAT 100. Our goal will be awareness-raising, specifically:
- characterizing types of missingness (missing data mechanisms);
- understanding missingness as a potential source of bias;
- basic do’s and don’t’s when it comes to missingness.
If you are interested in the topic, Stef van Buuren’s Flexible Imputation of Missing Data (the source of one of your readings this week) provides an excellent introduction.
Missing data mechanisms
Missing data mechanisms (like sampling mechanisms) are characterized by the probabilities that observations go missing.
For dataset X={xij} comprising
- n rows/observations
- p columns/variables
denote the probability that a value goes missing as:
qij=P(xij is missing)
Missing completely at random
Data are missing completely at random (MCAR) if the probabilities of missing entries are uniformly equal.
qij=qfor alli=1,…,nandj=1,…,p
This implies that the cause of missingness is unrelated to the data: missing values can be ignored. This is the easiest scenario to handle.
Missing at random
Data are missing at random (MAR) if the probabilities of missing entries depend on observed data.
qij=f(xi)
This implies that information about the cause of missingness is captured within the dataset. As a result:
- it is possible to estimate qij
- bias corrections using inverse probability weighting can be implemented
Missing not at random
Data are missing not at random (MNAR) if the probabilities of missing entries depend on unobserved data.
qij=f(zi,xij)zi unknown
This implies that information about the cause of missingness is unavailable. This is the most complicated scenario.
Assessing the missing data mechanism
Importantly, there is no easy diagnostic check to distinguish MCAR, MAR, and MNAR without measuring some of the missing data.
So in practice, usually one has to make an informed assumption based on knowledge of the data collection process.
Example: GDP data
In the GDP growth data, growth measurements are missing for many countries before a certain year.
We might be able to hypothesize about why – perhaps a country didn’t exist or didn’t keep reliable records for a period of time.However, the data as they are contain no additional information that might explain the cause of missingness.
So these data are MNAR.
Simple fixes
The easiest approach to missing data is to drop observations with missing values: df.dropna().
- Implicitly assumes data are MCAR
- Induces bias if data are MAR or MNAR
Another simple fix is mean imputation, filling in missing values with the mean of the corresponding variable: df.fillna().
- Only a good idea if a very small proportion of values are missing
- Induces bias if data are MAR or MNAR
Perils of mean imputation
Imputing too many missing values distorts the distribution of sample values.
Other common approaches to missingness
When data are MCAR or MAR, one can:
- model the probability of missingness and apply bias corrections to estimated quantities using inverse probability weighting
- model the variables with missing observations as functions of the other variables and perform model-based imputation
Do’s and don’t’s
Do:
- Always check for missing values upon import.
- Tabulate the proportion of observations with missingness
- Tabulate the proportion of values for each variable that are missing
- Take time to find out the reasons data are missing.
- Determine which outcomes are coded as missing.
- Investigate the physical mechanisms involved.
- Report missing data if they are present.
Don’t:
- Rely on software defaults for handling missing values.
- Drop missing values if data are not MCAR.